
How TradingView-Powered Charting on Bajaj Broking Elevates Your Analysis
The Bajaj Broking platform includes 13 chart types, more than 100 technical indicators and over 110 drawing tools.
- Initiatives News
- 4 min read


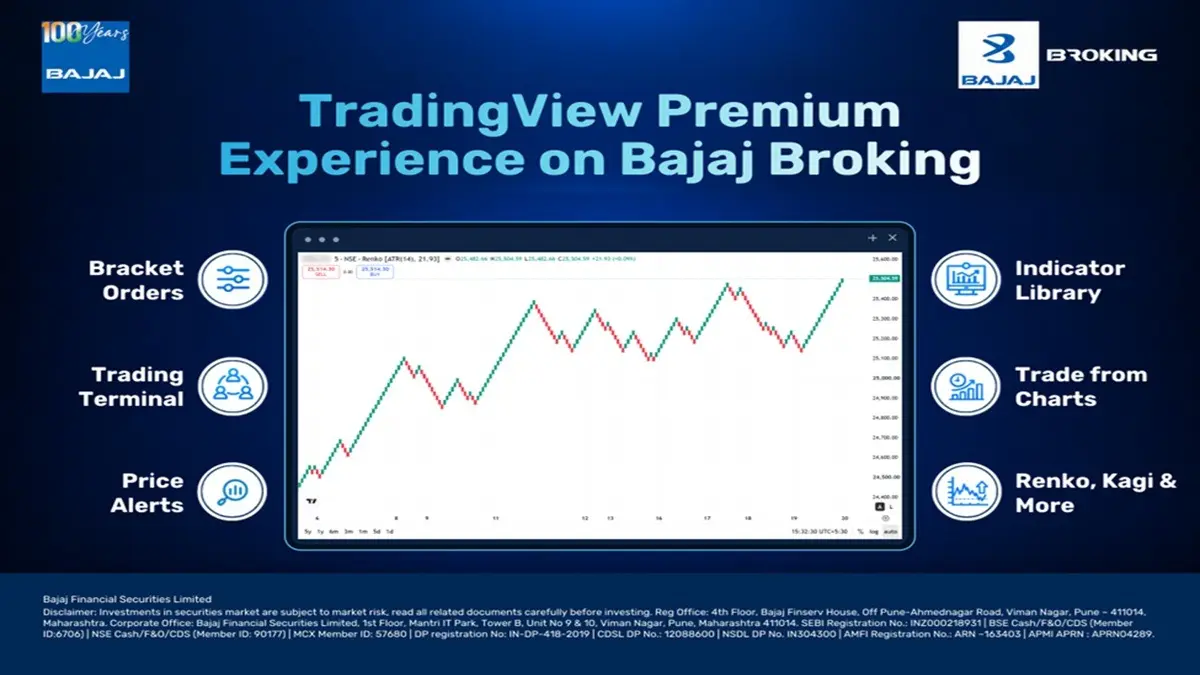
A line drawn on a chart is not yet a trading decision. A trader may identify resistance, mark an entry and decide where a stop-loss is to be placed. But those markings acquire practical meaning only when they become an order with a price, quantity and defined risk.
The handover from chart to order ticket is therefore worth examining. Bajaj Broking’s TradingView-powered charting brings chart analysis, order placement and position monitoring into a connected workspace on its platform, addressing a familiar problem: keeping the original trading plan in sight while acting on it.
Bajaj Broking Adds Depth to Technical Analysis with TradingView-Powered Charts
A candlestick chart provides a useful picture of price movement, but it is not the only way to study a market. Renko charts emphasise movements of a specified size; Point & Figure charts organise price changes differently from time-based charts. Each can reveal patterns less obvious in a conventional view.
Advertisement
The Bajaj Broking platform includes 13 chart types, more than 100 technical indicators and over 110 drawing tools. Traders can mark support and resistance, study momentum or volume, and compare charts across timeframes using synchronised layouts.
The choice of tools matters less than the questions asked of them. An indicator can help assess whether momentum supports a price move. A trendline can mark a level worth monitoring. Neither can establish that a breakout will succeed.
Advertisement
Integrated Charting on Bajaj Broking Streamlines Trade Execution
Suppose a trader has marked a possible entry and a level at which the trading idea would be invalidated. In a disconnected workflow, the next step might mean opening another screen, entering order details and returning to the chart to monitor the result.
The charting built into the Bajaj Broking platform shortens that sequence. Users can place supported trades directly from the charts within their Bajaj Broking account. Buy and sell controls sit alongside an advanced order ticket, while orders and positions can be viewed against the price movement that prompted them.
One practical feature is visual order adjustment. Supported pending orders can be modified by dragging their price levels on the chart. Rather than translating a revised decision into a separate set of fields, traders can see where the changed level sits relative to recent prices.
This improves the clarity of order management, not the certainty of execution. The final traded price still depends on the order type, available liquidity and market conditions.
Bajaj Broking Brings Watchlists, Alerts and Market Tracking Together
The next difficulty is attention. Following one instrument closely is manageable; watching several stocks and timeframes while monitoring an open position requires a more organised setup.
Custom watchlists group the instruments a trader follows. Price alerts flag selected levels without requiring constant screen-watching. Multiple chart layouts allow different timeframes or instruments to be examined side by side, while Depth of Market displays available buy and sell interest at quoted price levels.
Used together, these features help separate preparation from reaction. A trader can decide which price levels deserve attention before the market reaches them, rather than making every decision in response to the latest candle.
How TradingView-powered Charting on Bajaj Broking Elevates Market Analysis
A well-marked chart can still lead to a poor trade. No selection of indicators can eliminate false signals, slippage or unexpected volatility. However, an edge comes from how clearly traders analyse opportunities, define their trading levels and execute their decisions.
Bajaj Broking addresses these aspects by bringing advanced charting, technical indicators and direct order placement into one interface. Traders can identify potential entry and exit levels, place orders directly from charts and visually modify supported pending orders as market conditions change. Price alerts, multiple chart layouts and on-chart position monitoring further help traders stay focused on their trading plans.
By reducing the need to switch between charting and order-entry screens, the platform helps limit unnecessary manual steps and keeps trading decisions connected to the underlying price analysis. This is where greater market analysis becomes meaningful: not in predicting price movements, but in executing well-defined trading decisions with greater clarity and control.
Standard Disclaimer
Investments in securities market are subject to market risks, read all related documents carefully before investing.
Reg Office: 4th Floor, Bajaj Finserv House, Off Pune–Ahmednagar Road, Viman Nagar, Pune – 411014, Maharashtra. Corporate Office: Bajaj Financial Securities Limited, 1st Floor, Mantri IT Park, Tower B, Unit No 9 & 10, Viman Nagar, Pune, Maharashtra 411014. SEBI Registration No.: INZ000218931 | BSE Cash/F&O/CDS (Member ID:6706) | NSE Cash/F&O/CDS (Member ID: 90177) | MCX Member ID: 57680 | DP registration No: IN-DP-418-2019 | CDSL DP No.: 12088600 | NSDL DP No. IN304300 | AMFI - registered Mutual Fund Distributor Registration No.: ARN – 163403 | APMI APRN : APRN04289.
Website: Bajaj Broking