Updated 1 March 2020 at 14:35 IST
NASA's aerial images show decline in China's pollution levels amid coronavirus outbreak
In an unprecedented development, coronavirus has reportedly infected more than 85,000 and killed nearly 29,000 people hitting every continent except Antarctica.
- World News
- 2 min read

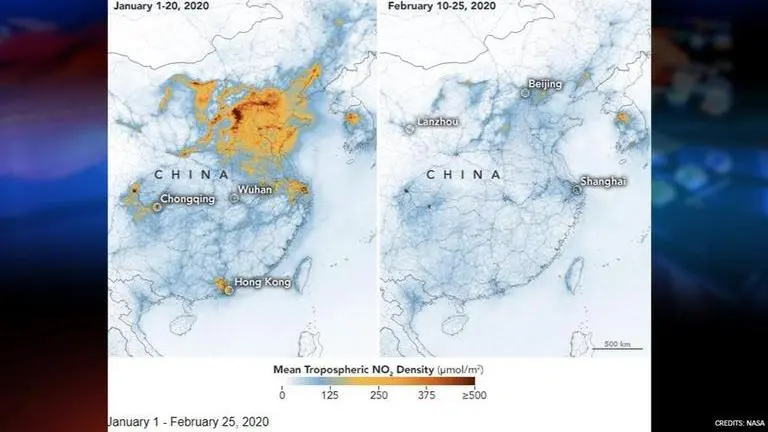
In an unprecedented development, coronavirus has reportedly infected more than 85,000 and killed nearly 29,000 people globally except Antarctica. However, the deadly virus has cleared the air in China. NASA recently released aerial images of Earth which showed a drastic decline in pollution levels over northern China in the past month.
Drastic difference
The aerial images which were released by NASA along with European Space Agency (ESA) on the former’s website compare the concentration of nitrogen dioxide across China between January 1-20 i.e. period before quarantine and February 10-25 i.e during the quarantine with results showing the drastic difference.
Advertisement
According to media reports, Nitrogen Dioxide levels typically surge in February as factories reopen and more vehicle take over the roads after the Chinese Lunar year. Fei Liu, an air quality researcher at NASA’s Goddard Space Flight Center, in public statement, said that it was the first time that she had seen such a “dramatic drop-off” in NO2. According to NASA, a similar case was observed during the 2008 recession but the decline was gradual. Another case was observed around Beijing during the 2008 Olympics but effects were localised around the Chinese capital.
Advertisement
Meanwhile, NASA released another set of images showing what the heatwave means to the local ice cap and glaciers in Antarctica. It aims to detail the dramatic changes in the ice and snow along the northern tip of the Antarctic peninsula. The picture takes a look at the Eagle Island on February 4 (left) which shows an abundance of ice coverage, whereas the picture on the right gives a view from February 13 which shows melted ponds and exposed ground.
Record warmth in #Antarctica is not without consequences. In just over a week, Eagle Island and nearby areas experienced major melting https://t.co/RvETiSALcc pic.twitter.com/CDyzTfG6oK
— Joshua Stevens (@jscarto) February 20, 2020
Published By : Riya Baibhawi
Published On: 1 March 2020 at 14:35 IST

